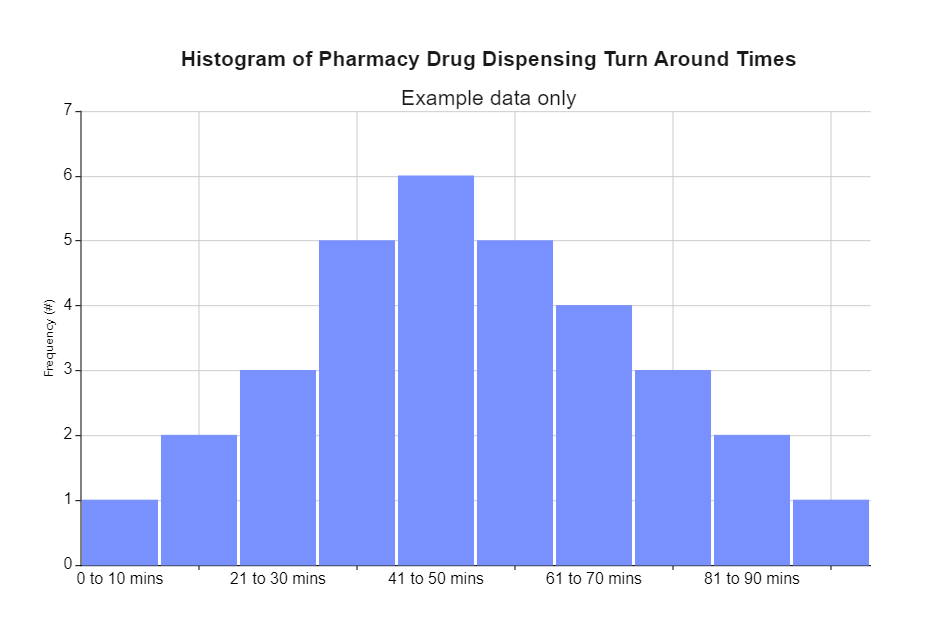
This Histogram Graph is a data representation that looks like a bar graph and buckets various outcomes into columns along the x-axis. The y-axis in this Histogram Graph shows the number count or percentage of occurrences in the data for each column and can be utilized to visualize the data distributions. It is one of the most common bar graphs used to visualize numerical data practically. A histogram is used to display the frequencies of different types of data. It is a graphical representation of data in which the data is organized into continuous number ranges, with each range represented by a vertical bar.


 Desktop