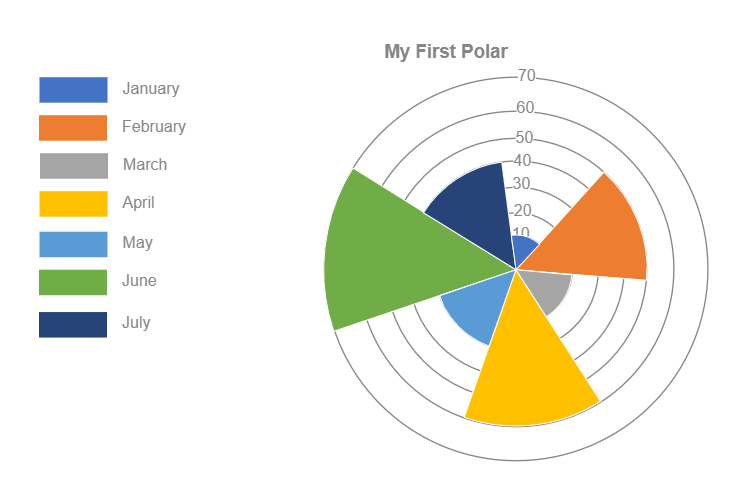
This Polar Area Chart is similar to pie charts in that each segment has the same angle; however, the segment's radius varies depending on the value. Polar Area charts are circular diagrams that use values and angles to display information in the form of polar coordinates. This Polar Area Chart is frequently used when we need to show comparison data similar to a pie chart and a scale of values for context. Polar area charts (also known as Polar area diagrams, Coxcomb charts, and Rose charts) are commonly used to plot cyclical data such as average monthly temperature, hourly website traffic, etc. Polar charts can be also used to display scientific data. You have the option of specifying a default measure.


 Desktop