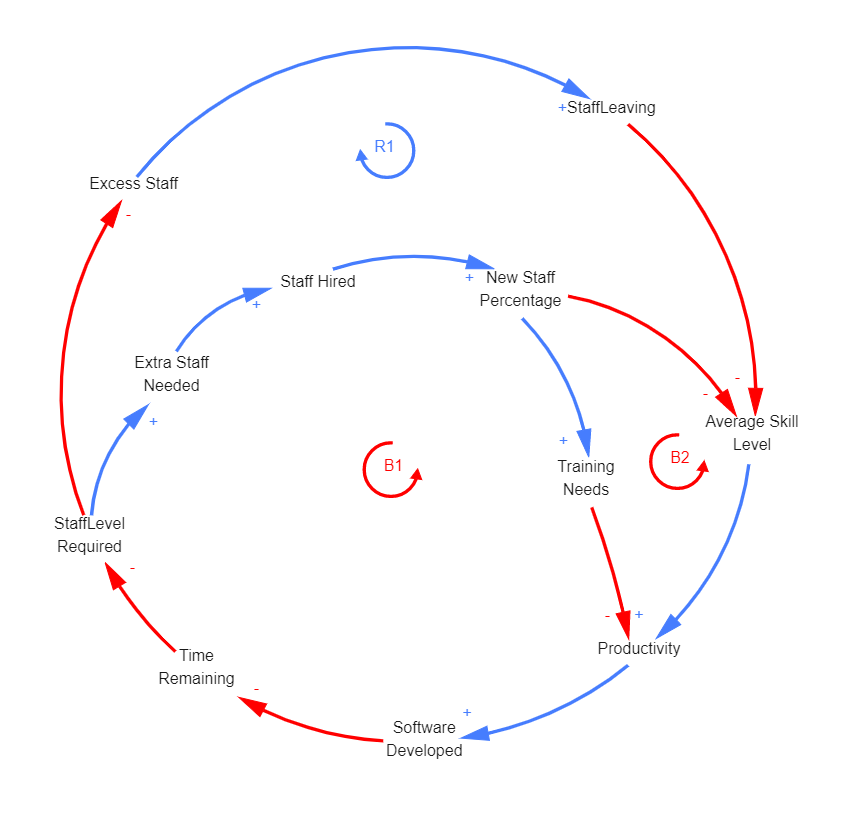
This Simple Causal Loop Diagram is a snapshot of all relationships that matter. A simple causal loop diagram visualizes key variables (i.e., factors, issues, processes) and how they are interconnected. Variables are represented as texts, and causal relationships are defined as arrows in these diagrams. Arrows show the direction of causality, the nature of the relationships (i.e., proportional or inverse), and whether there is any delay in the occurrence of an expected effect. Causal loop diagrams address a whole system thinking principle: A problem or its constituent parts (factors, actors, processes) cannot be understood in isolation. Everything in a system is linked to everything else.


 Desktop