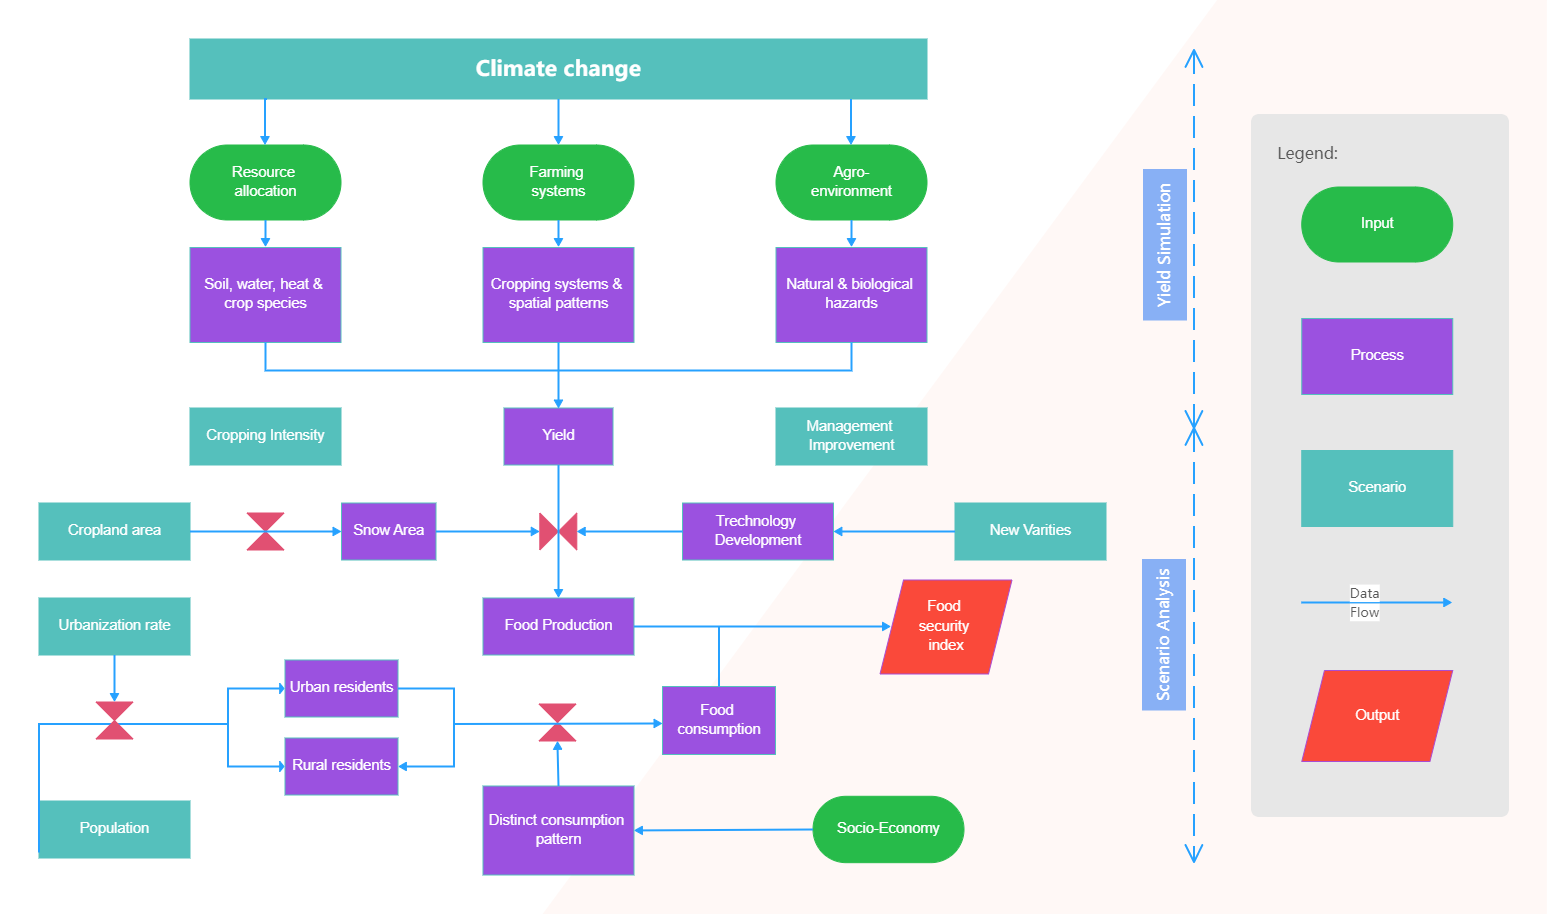
The climate change cycle is depicted in this flowchart. Many scientists now believe that climate change is much more likely to be part of a cycle of warming and cooling that has emerged every 1,500 years for the last million years without causing significant harm. Over the last million years, glacial and interglacial cycles have been triggered by variations in the amount of sunlight reaching the Northern Hemisphere in the summer, caused by small changes in the geometry of Earth's orbit around the Sun. The natural climate change cycle is also depicted in this Climate Change flowchart. The temperature of the Earth changes naturally over time. Warming and cooling can be caused by changes in the planet's orbit, solar cycles, and volcanic eruptions.


 Desktop