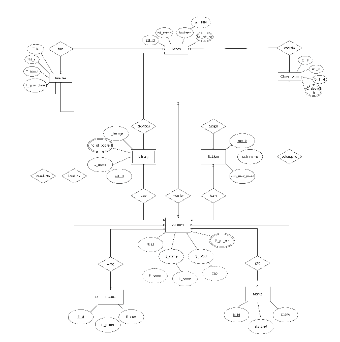
The student database ER diagram meticulously outlines the various entities that comprise the student database and the intricate relationships they share. Key entities such as use, monitor, and learn are highlighted by being encircled around solid rectangles, underscoring their significance within the database structure. The interconnections between these entities are depicted through linking lines, elucidating the dependencies and interactions, such as the relationship between use and learning, and the oversight of monitoring functions, which are essential for comprehending data dynamics and optimizing database performance.


 Desktop