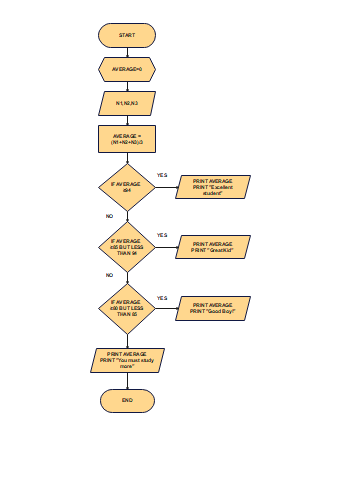
This flowchart displays the detailed steps involved in assessing students' average scores, starting with initializing the average score to zero and proceeding to evaluate students' performance based on specific assessment criteria, such as achieving or exceeding a score of 94. This process is useful for teachers to evaluate students' academic achievements and decide whether additional tutoring or rewards are needed.


 Desktop