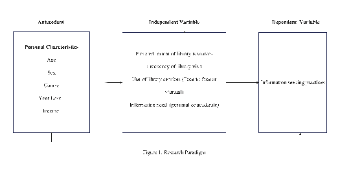
This is an ER diagram about Antecedent and Independent Variable, which describes various entities involved in the system, such as Age, Sex, Course, Income, and the relationships between these entities are represented as lines and arrows connecting rectangles. This type of chart makes it easier for managers to understand the relationships between different entities and design and maintain systems.


 Desktop