
Templates Community /
BCG Matrix Example Template
BCG Matrix Example Template
Community Helper
Published on 2022-05-27

 Desktop

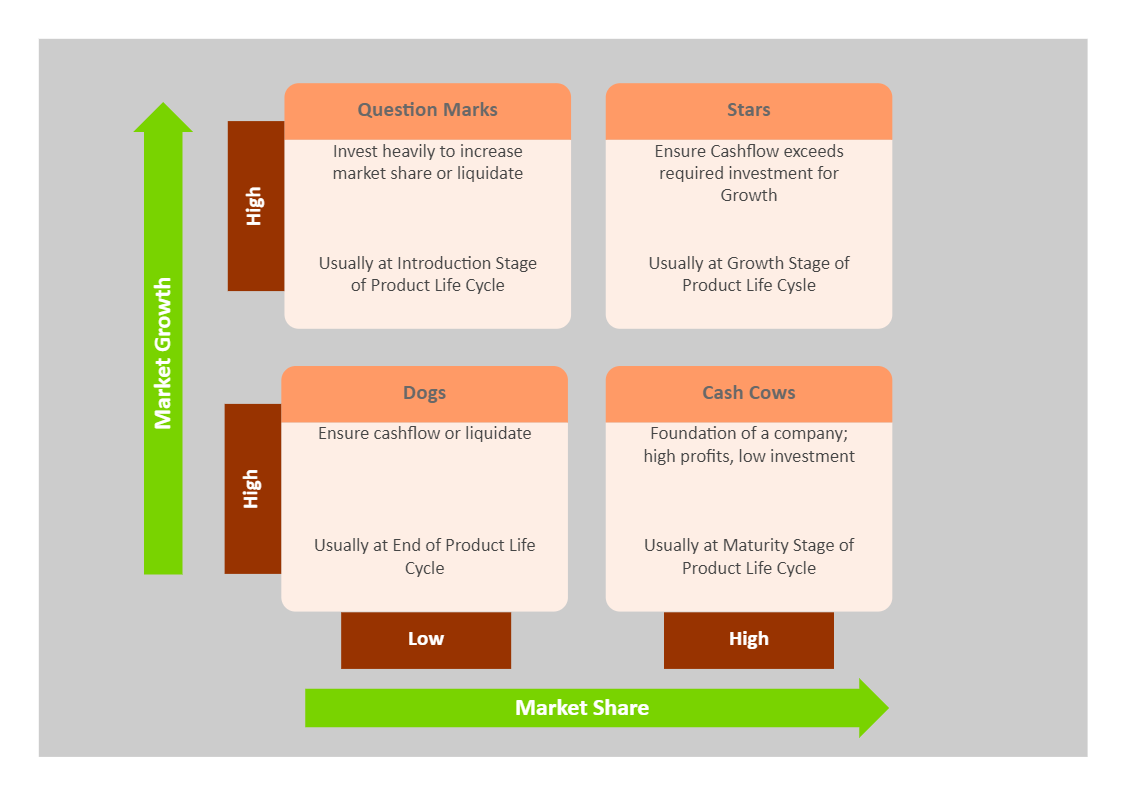
What is a BCG Matrix Example Template?
The BCG matrix (also known as the Growth-Share Matrix) is a portfolio planning tool that is used to analyze the products in a company's portfolio based on their growth and relative market share. The concept is based on the fact that the business divisions of a corporation may be categorized into four categories: The cash cows and the Stars. There are also question marks, and lastly, Dogs.
Benefits of a BCG Matrix Example Template
The Boston Matrix has the following benefits: It gives a high-level view of the prospects for each product in your portfolio. It allows you to consider how to deploy your limited resources to the portfolio in order to optimize long-term profit. It indicates whether or not your portfolio is balanced. For example, if you have too few goods in your portfolio, then you may be in the risky situation of having all your eggs in one basket.
How to create a BCG Matrix Example Template?
Step 1: Select the product. The BCG matrix may be used to analyze Business Units, specific brands, products, or a company as a whole. The unit used has an influence on the entire analysis. As a result, specifying the unit is required.
Step 2: Establish the market. A poorly defined market might result in poor product categorization.
Step 3: Determine the respective market share. Market share is the percentage of the overall market that your firm serves, defined in either revenue or unit volume terms.
Step 4: Determine the market growth rate. The industry growth rate may be simply determined using free web resources.
Step 5: Create a matrix using the circles. After you've calculated the following metrics, all that remains is to display the companies on the matrix.
Tips for creating a BCG Matrix Example Template
The x-axis represents relative market share, while the y-axis represents the industry growth rate. For each unit/brand/product, draw a circle, the width of which should ideally equal to the proportion of income earned by it.
With the help of EdrawMax, you can easily download and customize this BCG matrix example template. If you need real-time collaboration, head to EdrawMax Online and login using your registered email address.
Tag
matrix
Share
Report
0
104

Post
Recommended Templates
Loading
