
Templates Community /
Matrix Structure Diagram
Matrix Structure Diagram
Community Helper
Published on 2022-05-27

 Desktop

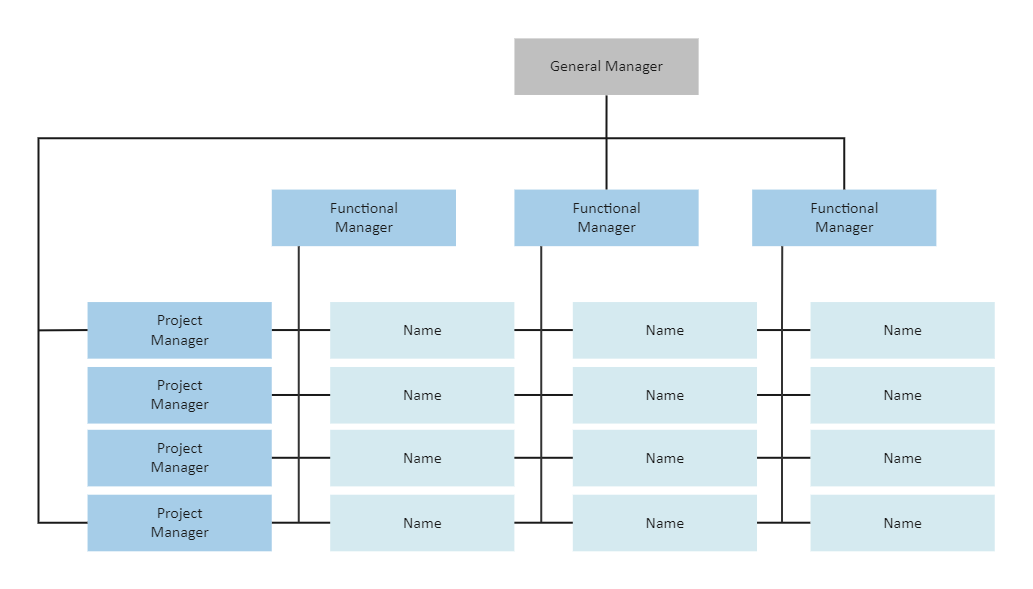
What is a Matrix Structure Diagram template?
The Matrix Structure Diagram is a mix of divisional and functional structures that are utilized for reporting levels both horizontally and vertically. It is frequently employed when a company must be extremely sensitive to a fast-changing external environment.
Benefits of a Matrix Structure Diagram template
Matrix diagrams are useful for illustrating complicated (many-to-many) connections. They assist project managers in identifying the many ways parts interact and rely on one another, allowing them to make better decisions, solve problems, and enhance procedures. Project managers can more clearly see the link between objectives, variables, and causes inside the company they are watching by arranging groups of items into a matrix chart of rows and columns.
How to create a Matrix Structure Diagram template?
Step 1: Open an Organization Chart Maker.
Step 2: Draw some shapes on your drawing board. Open Libraries, then choose Organizational Chart, then Organizational Chart Shapes, and finally Custom Organizational Chart. The left toolbar has a plethora of well-designed shapes.
Step 3: Apply elements to your shapes like shadowing and filling.
Step 4: Join the Shapes. Select Connector from the Home tab's Basic Tools. Link boxes together using your mouse.
Step 5: Give Your Matrix Org Chart a Theme. When you click Page Setup, you will see a variety of themes. Click each one to examine the effects and choose the appropriate one to apply to your chart.
Tips for creating a Matrix Structure Diagram template
The L-shaped chart is the most basic and often used matrix graphic. A two-dimensional table compares two sets of data.
The left-hand column represents one data set, which is compared to the second data set in the table's top row. The connection between pairs in overlapping cells is represented by numbers or symbols. To assist rank or to prioritize things inside the chart, tally the scores and record the totals on the end rows. With the help of EdrawMax, you can easily download and customize this template. If you need real-time collaboration, head to EdrawMax Online and login using your registered email address.
Tag
matrix
matrix collection
Share
Report
6
209

Post
Recommended Templates
Loading
