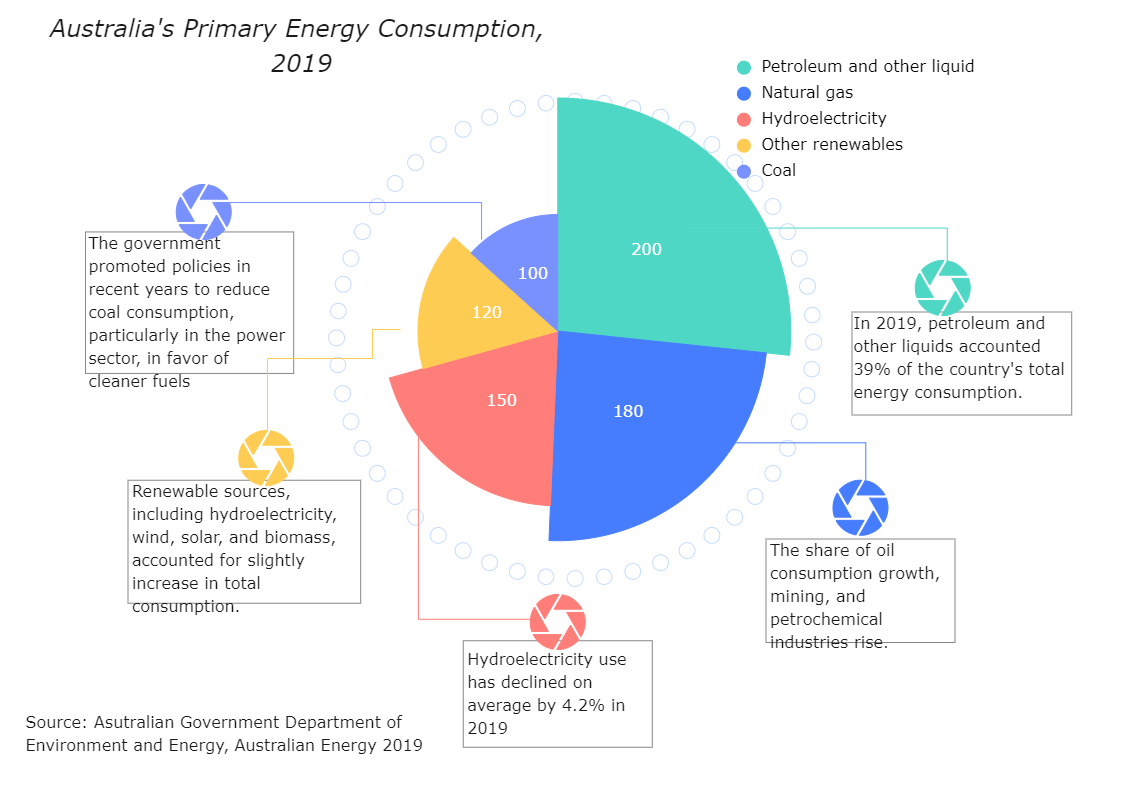
This is a pie chart about Australia's primary energy consumption. A pie chart is one sort of graph that illustrates the information in the circular graph. It is a type of graphical representation of data where the slices of pie depict the relative sizes of the data. A list of numerical and categorical variables is necessary for a pie chart. EdrawMax lets you draw pie charts with its ready-to-use templates.


 Desktop