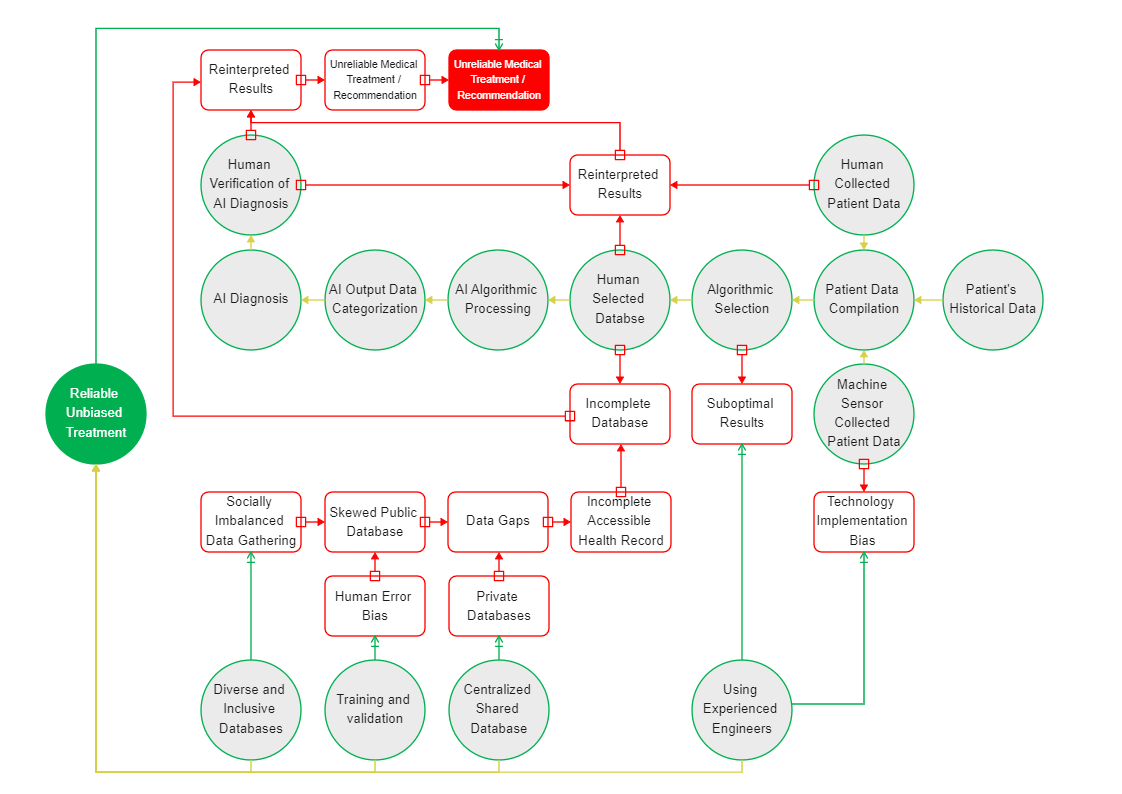
This is a cause and effect diagram about mitigating bias to promote fairness in artificial intelligence applications for healthcare. A cause-effect diagram is a visual tool used to depict potential explanations for a particular problem or consequence in increasing detail, suggesting causal links across ideas. Another name for a common form is a fishbone or Ishikawa diagram. A tree diagram can also be used to represent a cause-and-effect chain. On EdrawMax, you can easily create your own cause and effect diagrams.