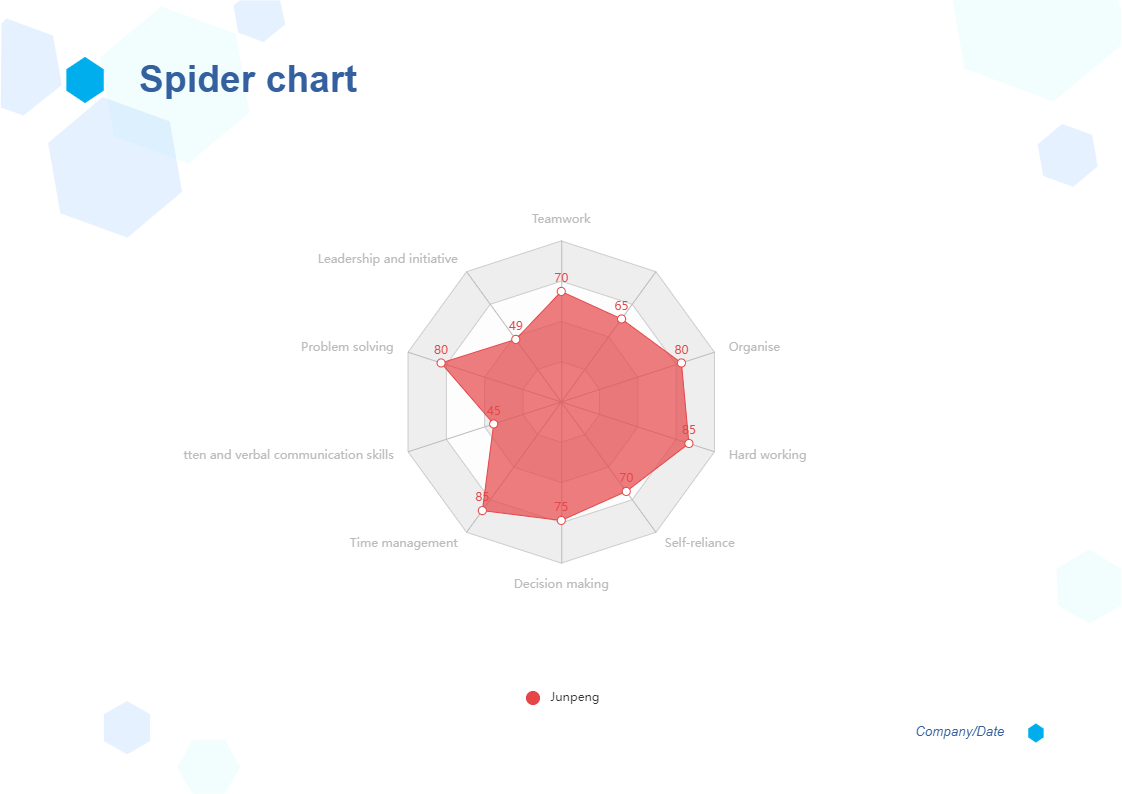
This is a spider chart example. A spider chart is a visual representation of multivariate data that uses two dimensions and at least three quantitative variables that are depicted on axes that all start at the same place. The Spider chart is made up of a series of equi-angular spokes, each of which represents one of the variables. EdrawMax lets you create a spider chart effortlessly.


 Desktop