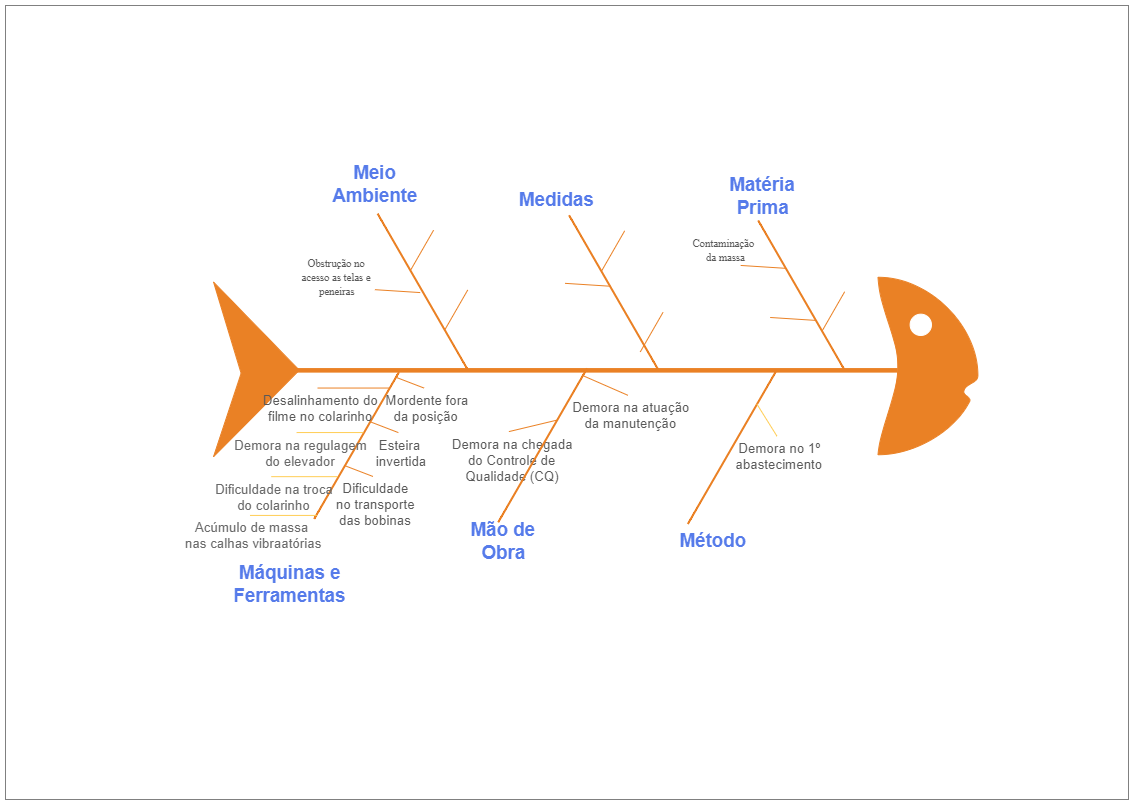
This is a fishbone diagram example. It is a tool for illustrating the link between a quality attribute effect and potential sources of variation. As seen below, the impact might be an issue that has to be fixed or the process's aim. On the cause and effect diagram, the effect would then be listed. The reasons include anything that might cause the condition. Download EdrawMax and start creating a cause and effect diagram in a few steps.