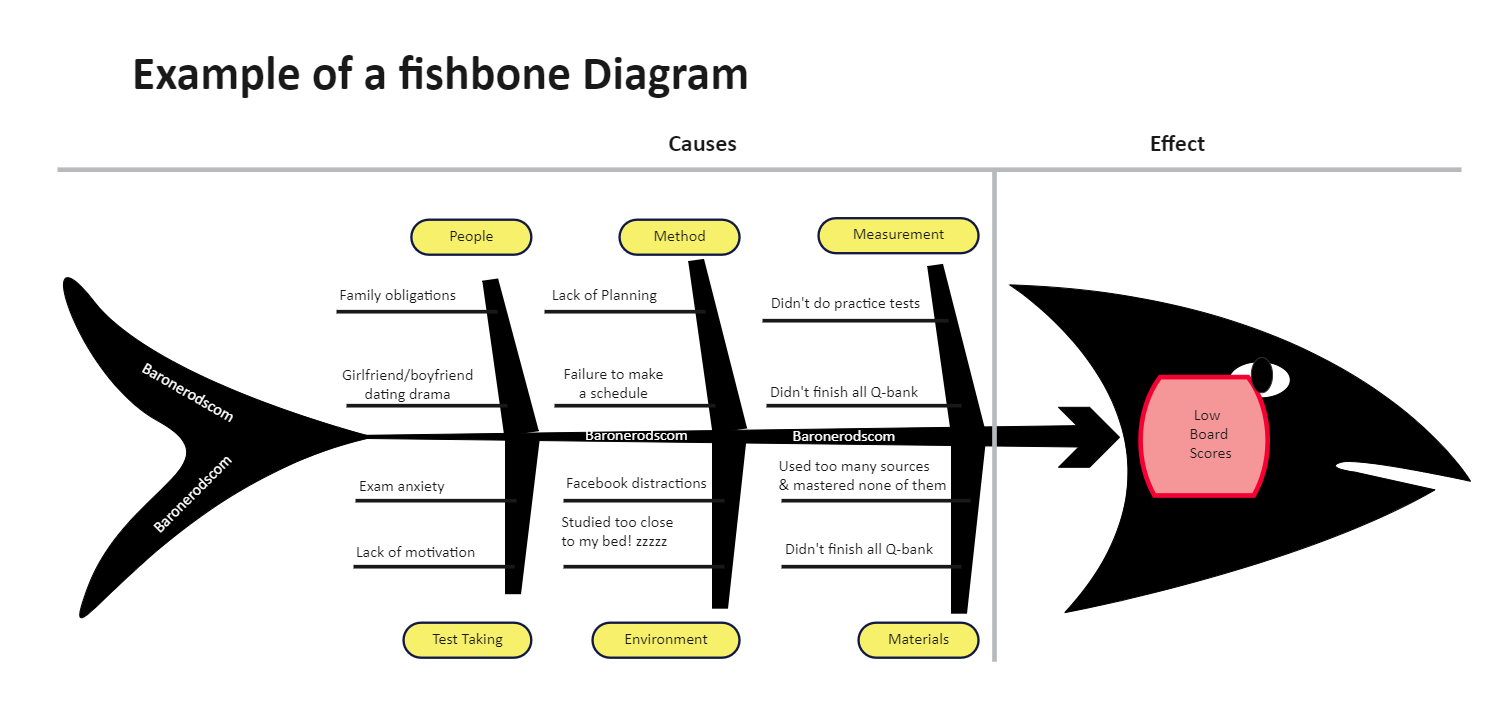
This Fishbone Diagram Example is a modern quality management tool that explains the cause and effect relationship for any quality problem that has occurred or may occur. It provides a visual representation of all possible causes of pain, allowing you to analyze and determine the root cause. It is a tool that can be used proactively as well as reactively. This Fishbone Diagram Example gets its name from the shape it takes after it is formed. Its structure is similar to that of fish bones. The problem is written on the right side of the fish's head. Its spine is on the left, with bone-like arrows pointing to the main causes.


 Desktop