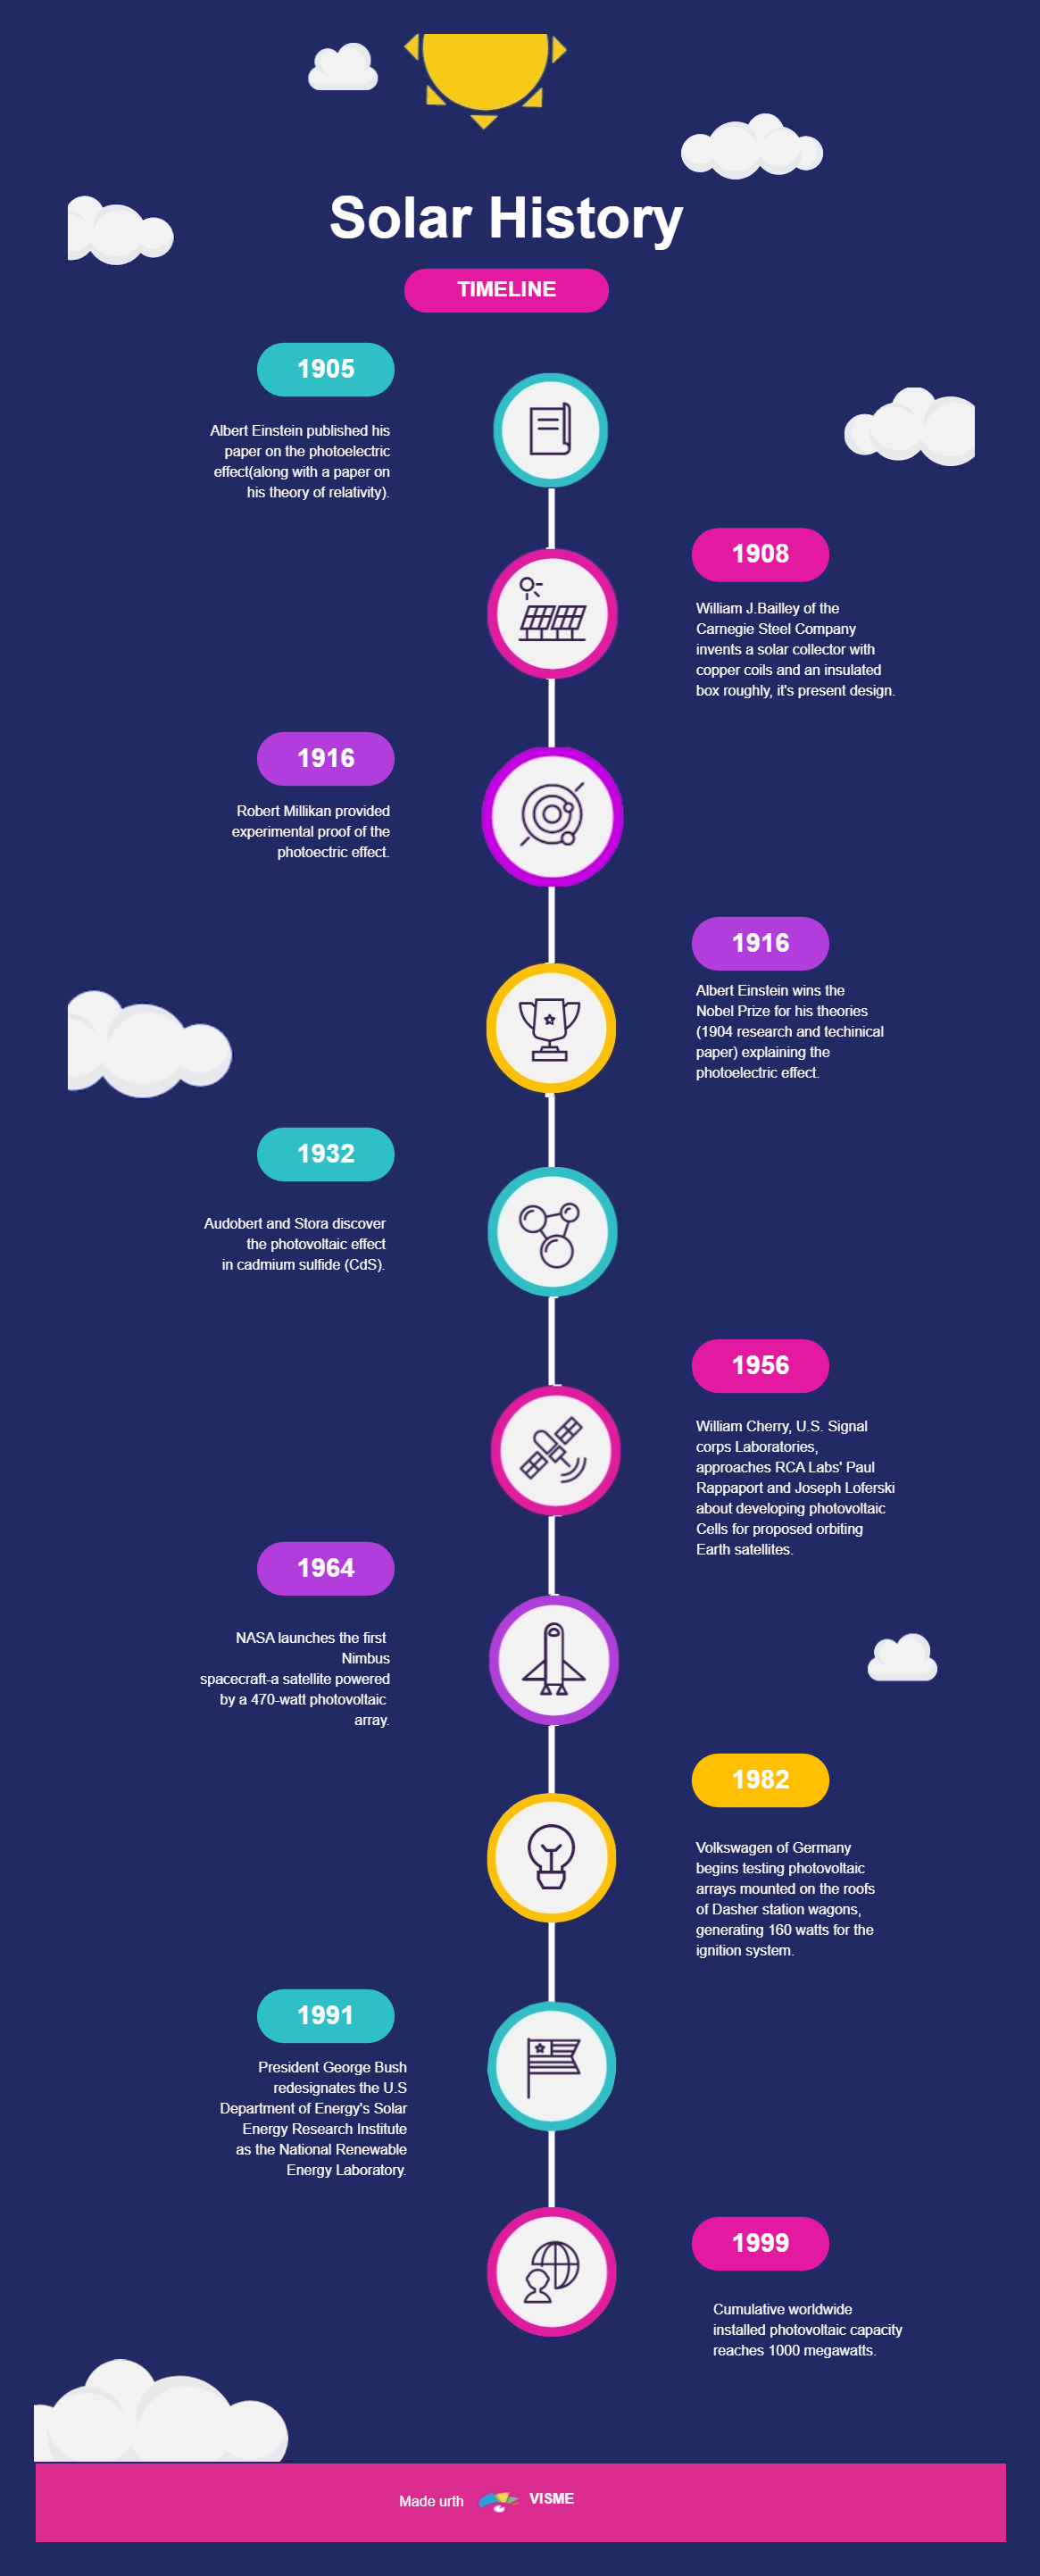
This solar energy timeline infographic traces the history of solar energy back to 4,000 B.C. While solar currently accounts for a small portion of the overall energy mix, there is no doubt that future skylines will be dotted with an increasing number of photovoltaic panels. According to the EIA, solar will grow at a CAGR of 39% in the United States between 2013 and 2017. Solar energy is radiation that can generate heat, cause chemical reactions, or generate electricity. This extremely diffused source has the potential to meet all future energy needs if properly harnessed.


 Desktop