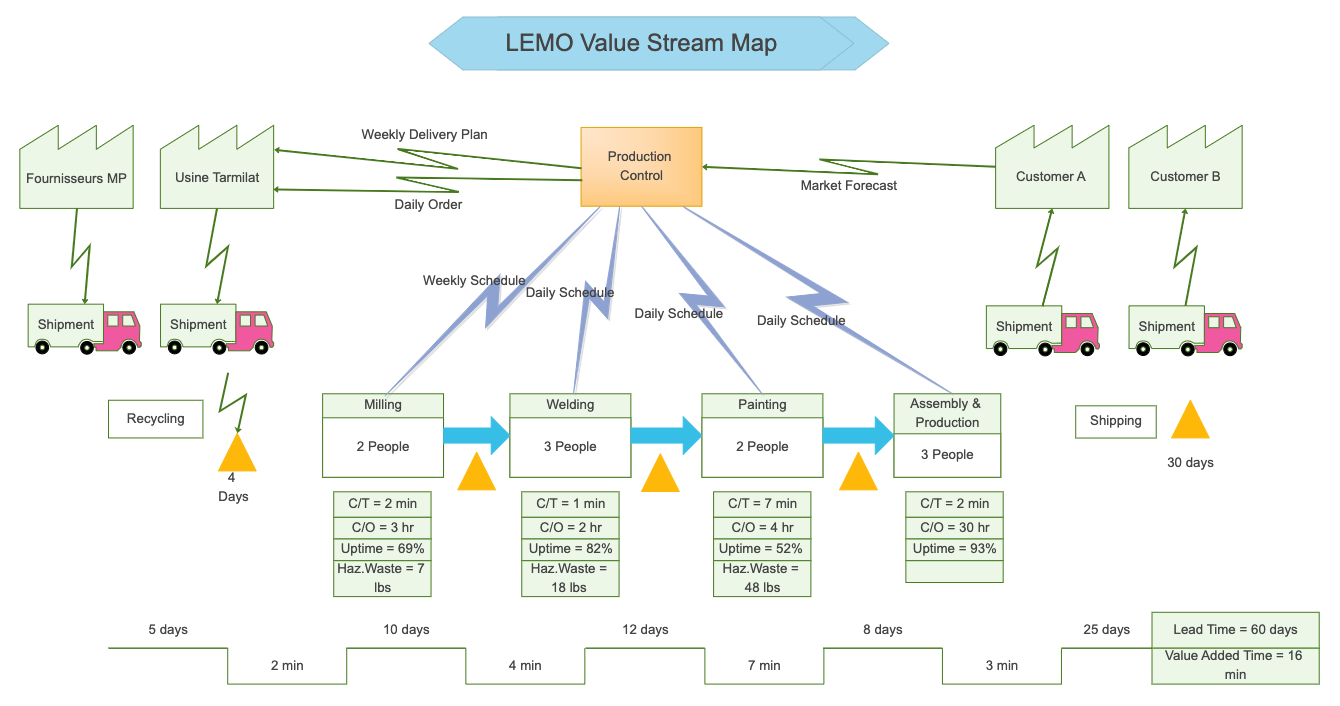
A LEMO Value Stream Map is a graphical representation of the flow of materials and data from the beginning of a production process to the end. It visually shows how delays or imperfections in one area can affect the overall efficiency of an organization's manufacturing or operations process. The map typically includes information such as inventory, cycle time, and the number of steps involved in each stage of production. It can help identify areas where improvements are needed and allow managers to visualize what their current production process looks like. EdrawMax is the best diagramming tool that helps in creating different diagrams, as mentioned here. With EdrawMax, you can create flowcharts, swimlane, network diagrams, and 280 other diagrams.