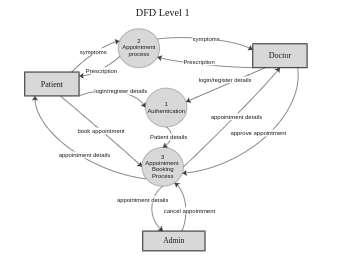
This is a Diagram of DFD Level 1, which is a graphical representation used to display various relationships between entities. In these graphs, entities are typically represented by circular nodes, such as Patient, Doctor, Admin. Through this diagram, we can clearly see the relationships between various entities and the flow of data, providing strong support for system analysis and design.


 Desktop