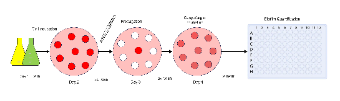
This template depicts the sequential steps of biofilm formation and quantification, from cell incubation to analysis. It includes clear visual representations for each stage: Cell Incubation (Day 1), Propagation (Day 2-3), Caspofungin Incubation (Day 4), and Biofilm Quantification using a microplate reader. Ideal for researchers and lab professionals, this diagram effectively communicates laboratory protocols and experimental workflows. Designed with EdrawMax, it is highly customizable for academic or professional use.


 Desktop