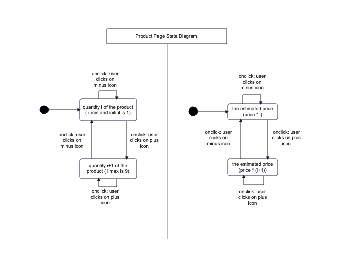
The image displays a state diagram that outlines the interactive process on a product page, specifically focusing on the actions related to adjusting product quantity and calculating the estimated price. The diagram is divided into two main parts. On the left, it shows the transitions based on user actions for increasing or decreasing the quantity of a product. The initial state allows the quantity to be increased from one up to a maximum of nine or decreased back down to one, following user interactions with plus and minus icons.
On the right side, the diagram connects these quantity changes to the corresponding updates in the estimated price, reflecting the cost as the product of the base price and the chosen quantity. Each action—either adding or reducing the product quantity—triggers an update in the estimated price, illustrating how the system responds dynamically to user inputs to provide real-time price calculations.
This map was created by EdrawMax.


 Desktop