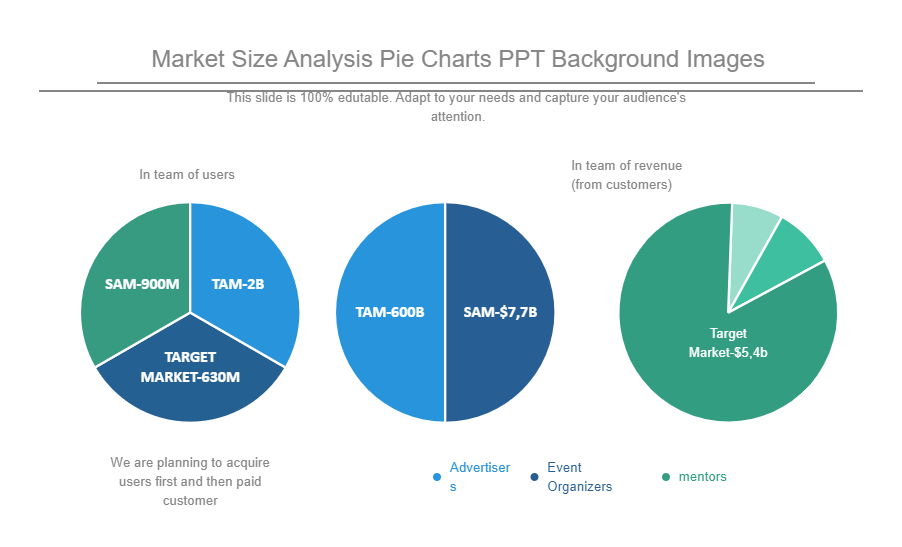
This Market Size Analysis Pie Chart Target Diagram depicts the division of a total amount into levels of a categorical variable as a circle further divided into radial slices. Each categorical value corresponds to a single slice of each circle, and the size of each slice indicates how much of the total each category level takes up. The pie chart above depicts the vote distribution in a fictitious election for a small city. The Reyes, represented by the first blue slice, has slightly less than half of the votes. To get started with Market Size Analysis Pie Chart Target Diagram, download this template from EdrawMax.


 Desktop