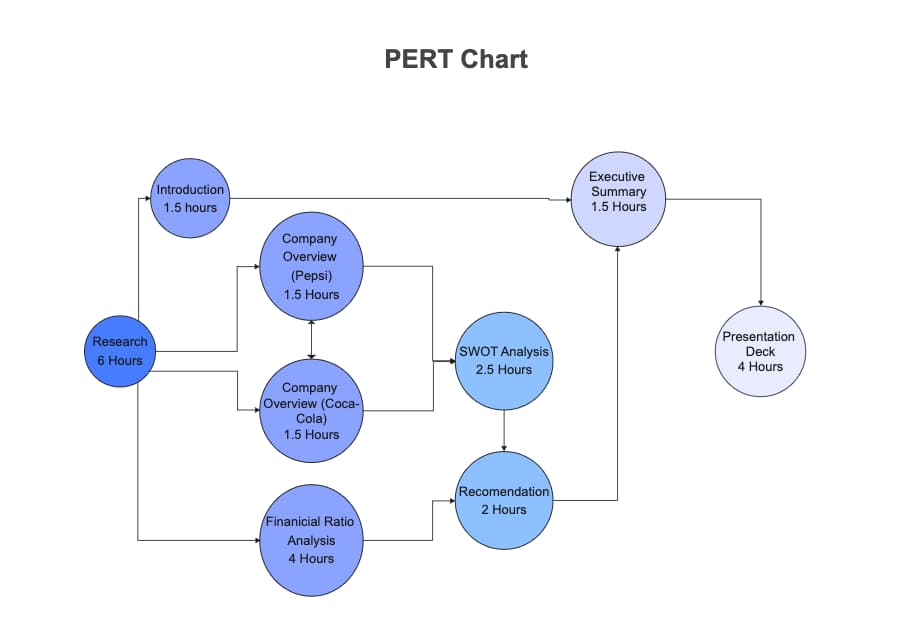
This diagram employs a PERT chart to detail the relationships between tasks, events, and timelines in project management. Entities such as research duration, presentation times, and review meetings are all critical components for the successful completion of a project. The diagram emphasizes the precise planning and time management skills required to coordinate complex tasks within tight schedules.


 Desktop