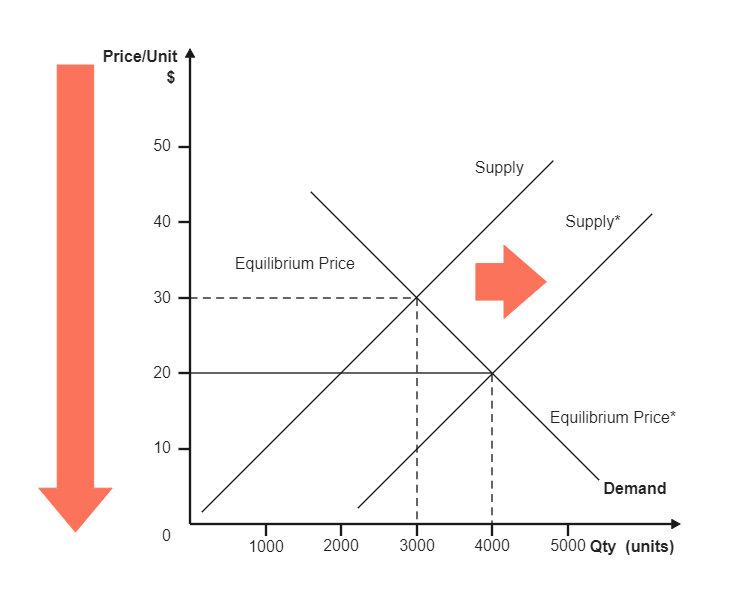
The fundamentals of supply and demand are easy to grasp. The challenge lies in deciphering their dynamic relationship. Its not as simple as saying supply and demand are inversely proportional, because both can rise and fall at the same time. When plotted, the SUPPLY CURVE appears as a rightwardsloping line. The supply curve moves to the right if more of the good is made available. Whenever there is a drop in demand, the supply curve shifts to the left. The DEMAND CURVE is represented by a downwardsloping, rightpointing line. The demand curve, which slopes downwards, shifts to the right as the quantity demanded rises. A leftward shift of the curve indicates a decline in demand.


 Desktop