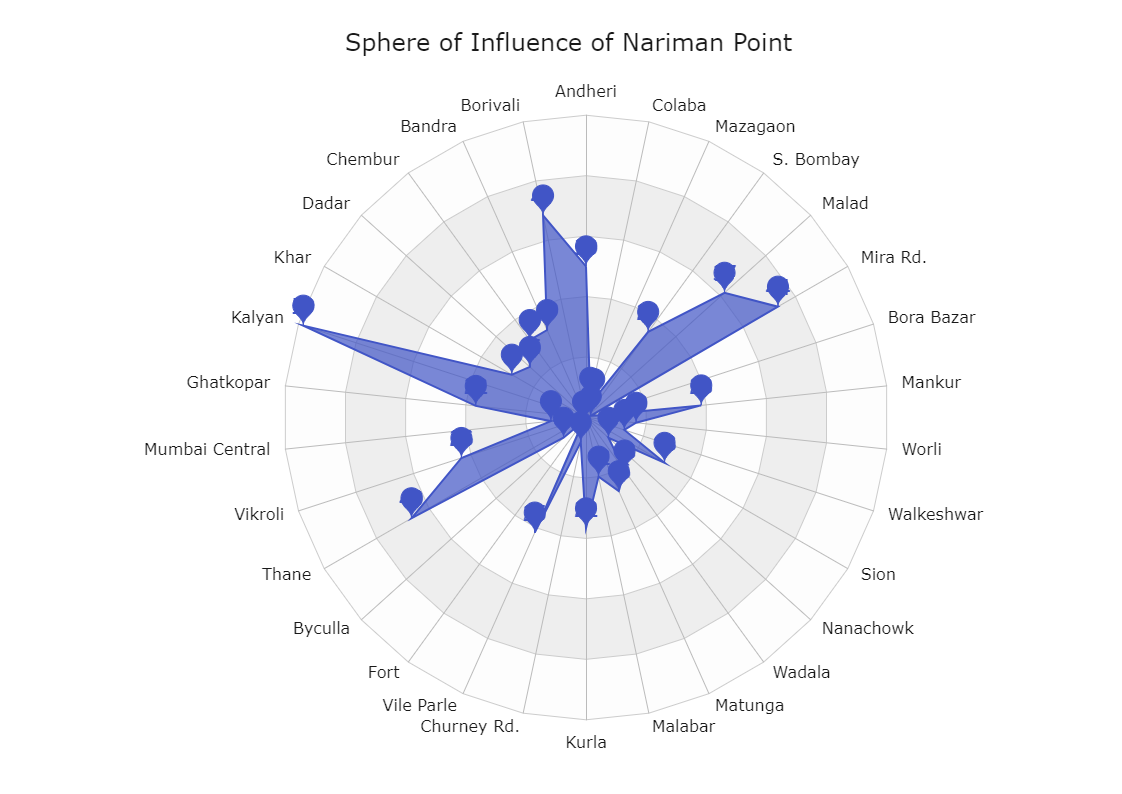
This spider chart is about Sphere of Influence of Nariman Point. A spider chart, also known as a radar chart, is commonly used to represent data over many dimensions. With a few exceptions, these dimensions are usually quantitative and range from zero to a maximum value. Each dimension's range is normalized to one another, so that when we build our spider chart, the length of a line from zero to the highest value of each dimension will be the same.


 Desktop