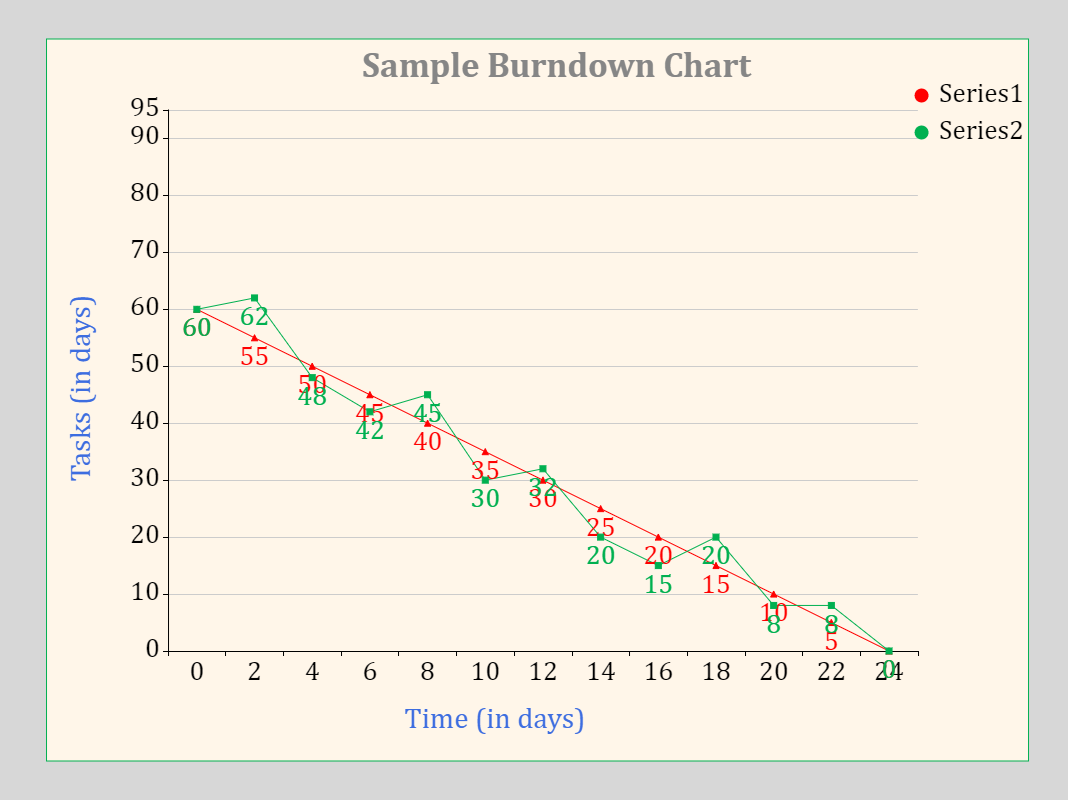
A burndown chart displays the amount of work completed in an epic or sprint as well as the total amount of work remaining. Burndown charts are used to forecast your teams chances of finishing their work in the time allotted. Theyre also great for keeping the team informed of any scope creep. The unit of measurement used by your team to estimate work is the estimation statistic. You can measure work in Jira Software by using story points, hours, or your own statistic.


 Desktop