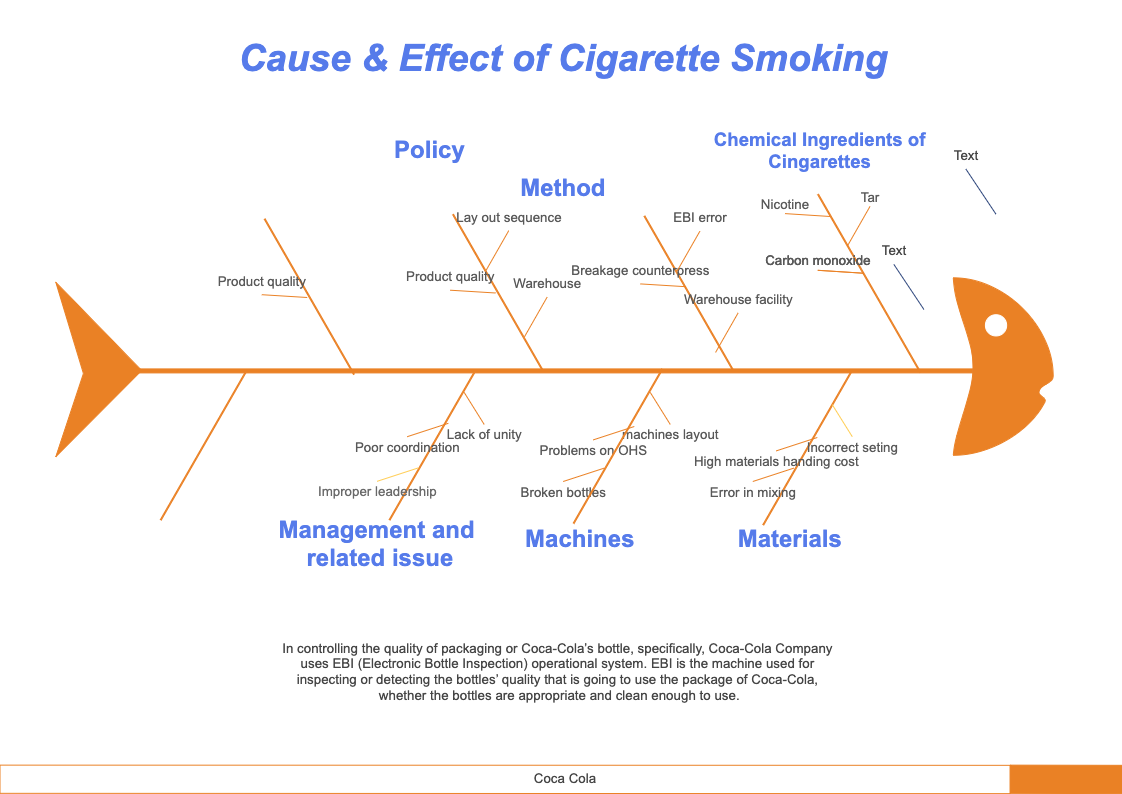
The fishbone diagram, also coined as the cause and effect diagram or sometimes the Ishikawa diagram, is a popular tool used to identify the possible causes of a particular problem. This type of diagram can be especially useful in the context of smoking cigarettes, as it helps identify all the potential reasons that may be contributing to the side effects associated with smoking. With EdrawMax, you can easily customize a similar fishbone diagram to illustrate different side-effects.


 Desktop