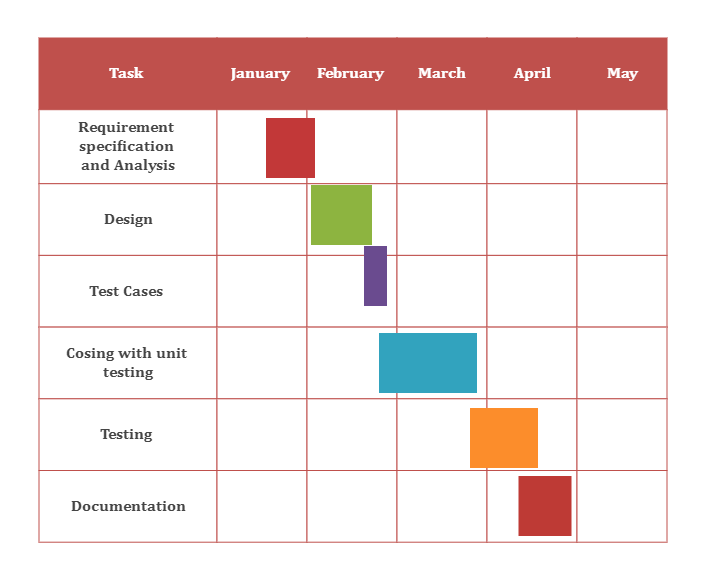
Progress in Development In 1917, American engineer and social scientist Henry L. Gantt created the horizontal bar chart, now known as the Gantt Chart, as a tool for managing production. A Gantt chart shows a graphical representation of a schedule commonly used in project management to plan, coordinate, and track tasks. Created manually on graph paper or automatically in project management software like Microsoft Project or Excel, Gantt charts come in various forms and complexity levels.


 Desktop