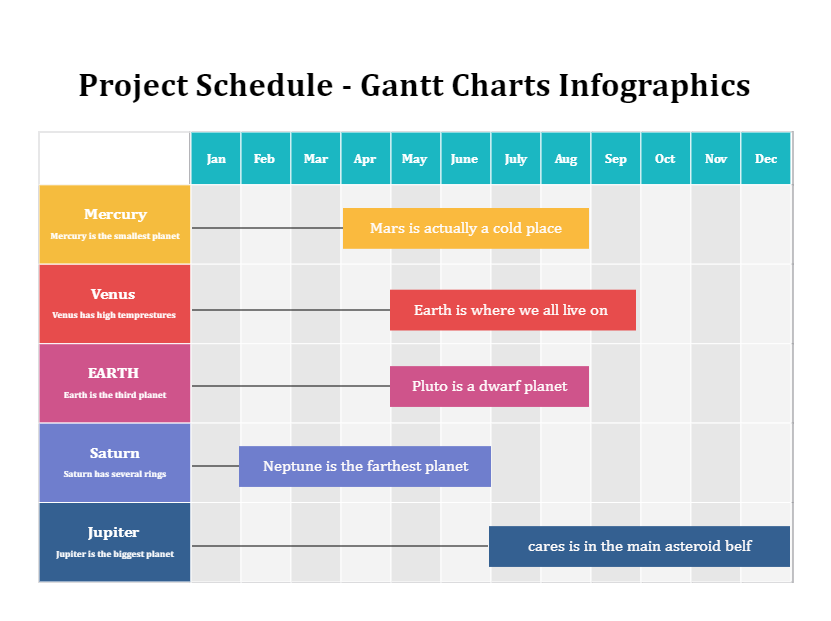
This Project Schedule Gantt Charts Infographics is a tool used in project management that shows how much work has been executed in a given time frame compared to the total time allotted for the project. Task start and end times, milestones, task dependencies, assignees, and more can all be displayed in a Gantt chart. Henry Gantt developed charts in the early 20th century to track the time it took for workers to complete a given task. Supervisors were able to quickly assess whether or not production needed to catch up, be ahead of, or be on track. Gantt charts were revolutionary in project management, allowing for the efficient administration of massive construction projects like the Hoover Dam and the Interstate Highway System.


 Desktop