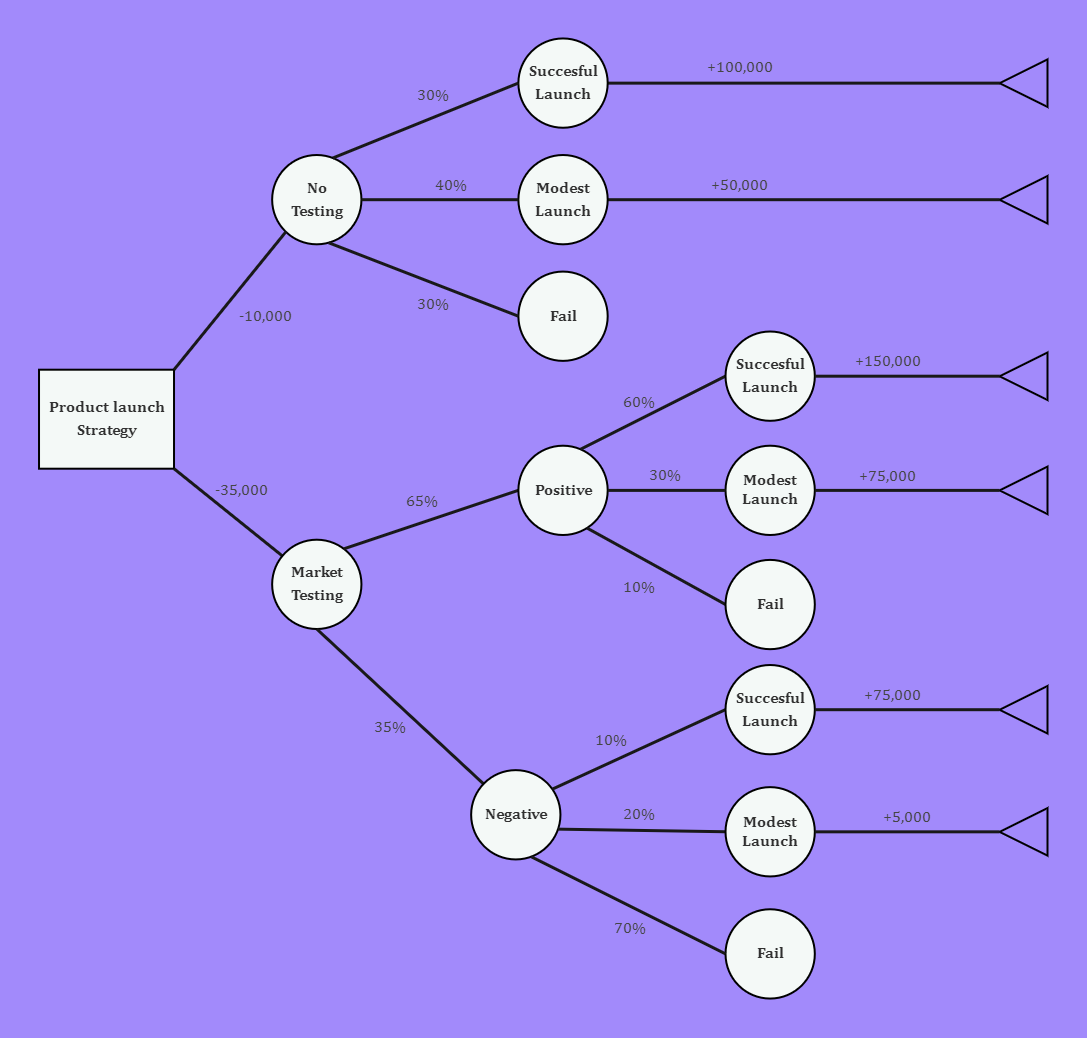
A Decision Chart is a visualization tool used to make decisions quickly and effectively. It consists of several elements, including nodes, branches, decisions, and uncertain outcomes. Nodes are represented as squares or circles and connected with lines representing possible solutions. When creating a chart, users assign values to each line to compare them numerically. This can involve assigning percentages or fractions that will add up to 1 or 100 (respectively) for the node’s branches. For each triangle at the end of the branches, users should assign possible outcomes to calculate their results by multiplying the result by the percentage probability for each outcome after subtracting the cost of taking that course of action. Here we have a product launch strategy diagram illustrating different decisions.


 Desktop