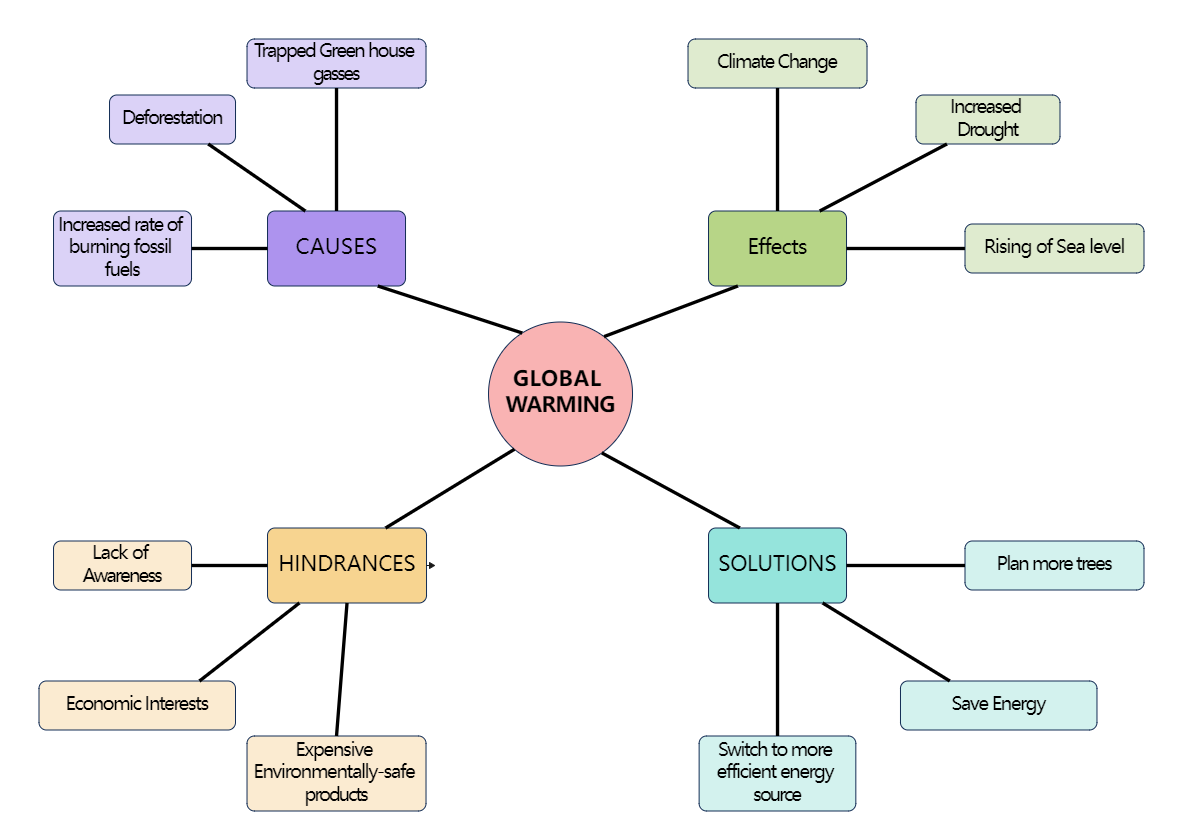
This is a spider chart collecting some ideas relevant to global warming. Trapped greenhouse gas, deforestation, and increased rate of burning fossil fuels are the main causes of global warming. As a result, climate change, increased drought, and rising sea levels will come after global warming. To tackle the problem, human beings can plant more trees, save energy, and switch to more efficient energy sources. It is also noticeable that there are also several hindrances on the way to solving global warming, which are the lack of people's awareness, economic interests, and expensive environmentally-safe products. To learn more details, you can check the above diagram or make one with EdrawMax.


 Desktop