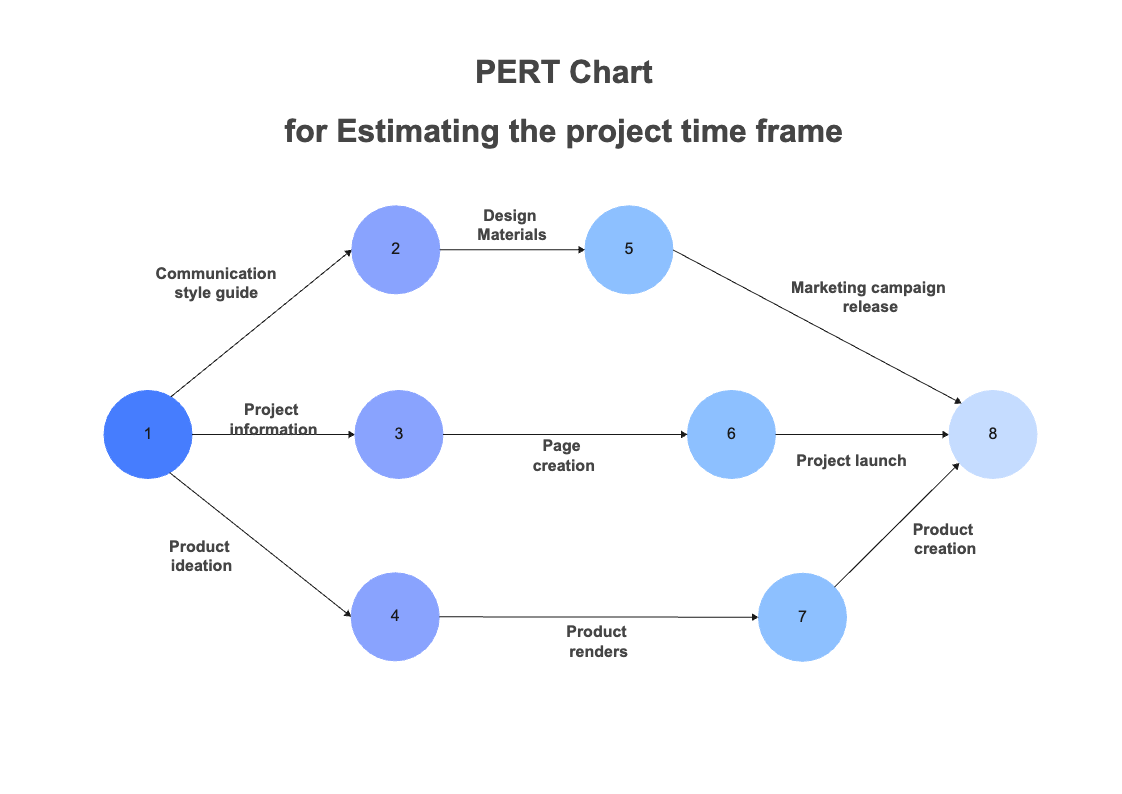
A PERT chart is a helpful tool for estimating the project timeline. It breaks tasks down into activities, some of which can be completed in parallel and tracked from start to finish. The project timeline includes both expected and contingency time estimates for each activity so that it can be tailored to the specific needs of the project. With a PERT Chart, project managers are able to identify delays in the completion of activities more easily and thus build an accurate timeline for completing any given project. Similar design templates are readily available at EdrawMax. Users can easily access template collections at EdrawMax and download them for personal and professional usage.


 Desktop