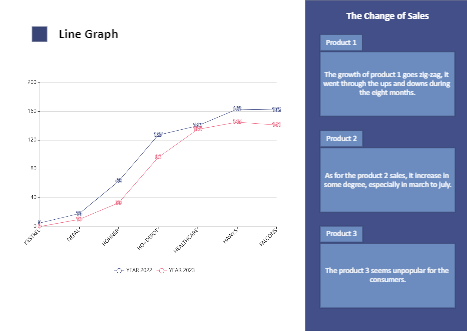
This template presents a sales analysis of three products. The line graph on the left shows the sales figures for Product 1 (blue line) and Product 2 (red line) across different categories (KESTREL, NEPAL, etc.) in 2022 and 2023. Product 1's growth is zig-zag with ups and downs over eight months. Product 2's sales increase, especially from March to July. On the right, it's noted that Product 3 seems unpopular among consumers. This visual aid helps in quickly understanding the sales performance and trends of each product, enabling better decision-making and strategy formulation for sales and marketing teams.