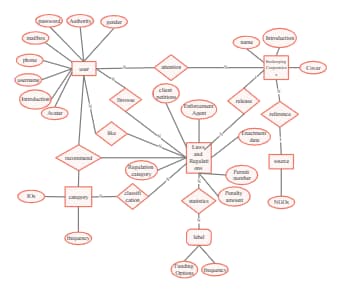
Explore this ER diagram for the beekeeping project. It displays the structure and relationships between different entities involved in the project management system. Entities like user, category, and beekeeping cooperatives, are represented as rectangles, and attributes are represented as circles around the entity rectangles. This kind of diagram helps to provide a clear and accurate representation of the database structure, facilitating communication among stakeholders and ensuring that the final product meets the needs and expectations of users.