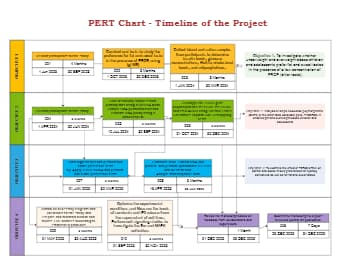
A PERT chart, sometimes called a PERT diagram, is a project management tool used to schedule, organize and coordinate tasks within a project. Here is a project PERT sample. As the template shows, it consists of series of charts, with each chart represents a project objective. The time for each objective is clearly shown in these charts. PERT charts are commonly used in conjunction with other project management techniques, such as critical path analysis and earned value analysis, to provide a comprehensive view of a project's risks and performance.