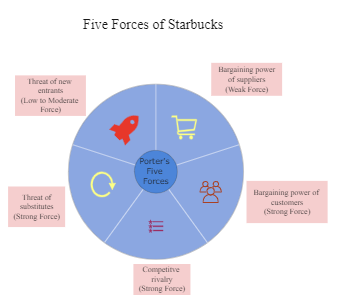
This pie chart displays the distribution of bargaining power among different roles within the supply chain. The sectors are Bargaining power of suppliers, Threat of new entrants, Competitve rivalry, with each sector's size indicating the influence of these factors in the supply chain. This detailed chart assists companies in evaluating supply chain stability and negotiation stances.


 Desktop