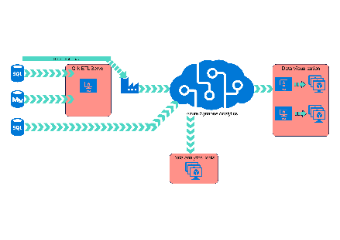
This is an architecture diagram representing a data flow in an analytics architecture. It shows data sources (SQL and MySQL databases) being processed through an ETL (Extract, Transform, Load) server, specifically a Qlik ETL Server running an SSIS (SQL Server Integration Services) full load. The processed data is then sent to Azure Synapse Analytics, a cloud-based analytics service, which interacts with data analytics tools. The final stage in the diagram is data visualization, suggesting that the processed data is used to generate visual reports or dashboards, likely facilitated by virtual machines (VMs) dedicated to this task.


 Desktop