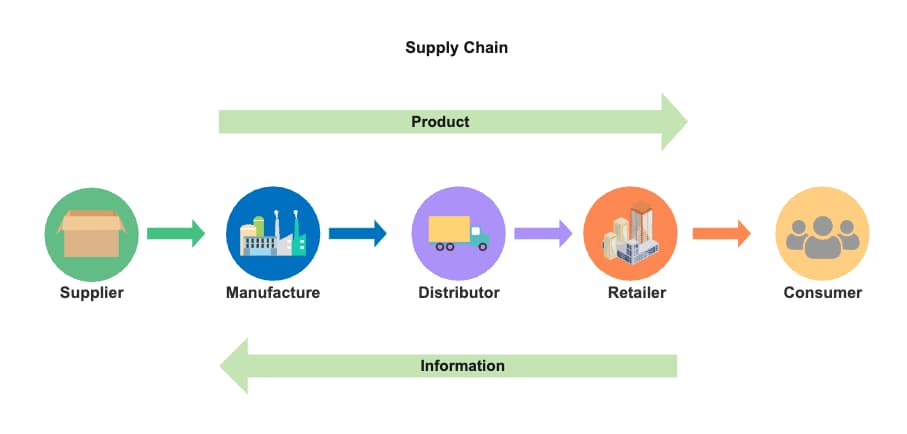
This diagram provides a visual representation of the standard supply chain process in a consumer goods context. It begins with the supplier providing raw materials or components, which are then manufactured into products. These products are transported by a distributor and eventually sold to consumers through retailers. Importantly, the diagram also includes a feedback loop of information, which represents the data and insights collected from consumers and retailers that flow back to the supplier and manufacturer. This feedback is vital for adjusting production, improving products, and better meeting consumer demand. Click to learn more details from this map and try to use EdrawMax to create diagrams for your academic and professional work.


 Desktop