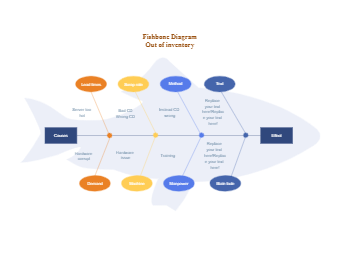
A Fishbone Diagram, also known as an Ishikawa Diagram or a Cause-and-Effect Diagram, is a visual tool used in quality management and problem-solving. Here is a sample for the solutions of out of inventory. As the template shows, the diagram looks like a fishbone with the problem at the head and the potential causes branching out like the bones of a fish. Each cause is listed on a separate branch, and sub-causes can be further branched out from the main causes. This helps to identify and prioritize the root causes of a problem, making it easier to develop solutions.


 Desktop