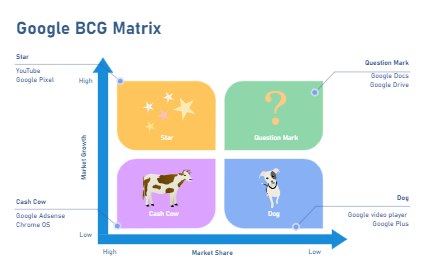
This infographic provides a strategic analysis of Google's product portfolio using the BCG matrix framework. It identifies high-growth, high-market share products like YouTube and Google Pixel as Stars, showing potential for further growth.
Google Docs and Google Drive are categorized as Question Marks, indicating uncertainty and requiring strategic decisions for future investment. Established products with high market share but low market growth, such as Google AdSense and Chrome OS, are listed as Cash Cows, generating steady revenue. Products like Google Video Player and Google Plus are labeled as Dogs, suggesting low market share and growth, often indicating a need for divestment.
This template can be used in academic settings for teaching strategic management concepts, in business presentations for product strategy discussions, and for companies looking to apply the BCG matrix to their product analysis.


 Desktop