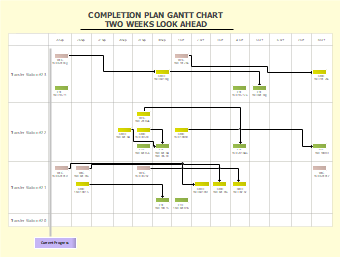
A Gantt chart is a graphical representation of a project's timeline, showing the start and end dates of each task, as well as the dependencies between tasks. This template consists of a horizontal axis representing time, and a vertical axis representing the different tasks or activities in the project. Each task is represented by a bar, with the left end of the bar indicating the task's start date, and the right end indicating the task's end date. It can be used in project management to plan and schedule complex projects, and to track progress over time.


 Desktop