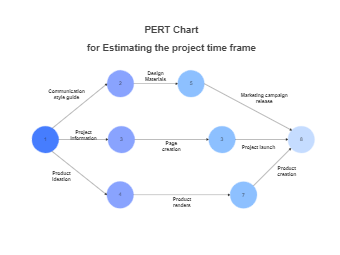
The image depicts a Program Evaluation Review Technique (PERT) chart, a project management tool used for scheduling and organizing tasks within a project. This PERT chart outlines the essential phases and sequence of activities required for project completion. It begins with node 1, representing the project's initiation with activities like 'Product ideation' and 'Communication style guide'. From there, the chart expands into multiple pathways, indicating parallel processes such as 'Project information' leading to 'Page creation', and 'Design Materials' leading to 'Marketing campaign release'. Each node is numbered, signifying the order of operations and their interdependencies. For example, 'Product renders' at node 4 must be completed before 'Product creation' at node 7, which in turn is a prerequisite for 'Project launch' at node 8. This chart is a visual tool for estimating the project time frame, highlighting the flow of tasks and the critical path necessary to advance the project from conception to launch.


 Desktop