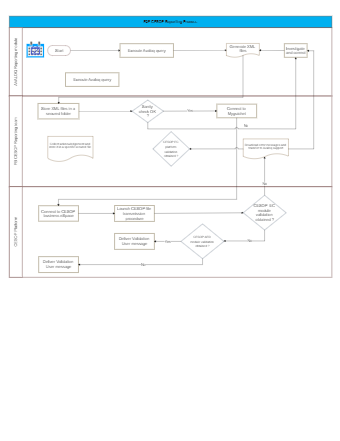
The image outlines a complex flowchart for an ECE CBOP (European Centralized Operations Platform) reporting process, segmented into distinct modules for organizational clarity. The process begins with the execution of an 'Avaloq query', followed by two potential paths: generating XML files or storing XML files in a secured folder. If the generated XML files do not pass the 'Sanity check', the process requires investigation and correction.
If the sanity check is passed, the system attempts to connect to 'Myguichet'. Failure to connect triggers the downloading of error messages and transfer to Avaloq support. If a connection is established, the flowchart proceeds to the next module, 'ECBOP EC', to perform validations. A negative result in validation leads back to the previous error handling step, while a positive result advances the process to the 'CESOP' module.
In the CESOP module, the system connects to the CESOP business eSpace and launches a file transmission procedure. Following this, the flowchart shows a decision point where, if module validation 'CESOP EC' is successful, a 'Validation User message' is delivered. If the module validation 'CESOP AAD' is unsuccessful, the process does not proceed to message delivery, indicating a loop back for further action until successful validation is obtained.
The flowchart employs standard symbols, including rectangles for processes, diamonds for decision points, and arrows indicating the flow direction. It reflects a systematic approach to handling data reporting, with checkpoints for quality assurance and error handling built into the sequence of operations.