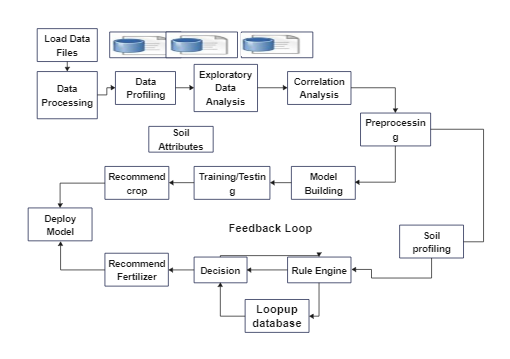
Presented by Edraw, this flowchart maps out a data processing cycle, specifically tailored for soil data analysis. It's an invaluable tool for data scientists and agronomists, detailing steps from loading data to deploying models, with feedback loops for decision-making. This detailed representation facilitates understanding and managing complex data workflows.


 Desktop