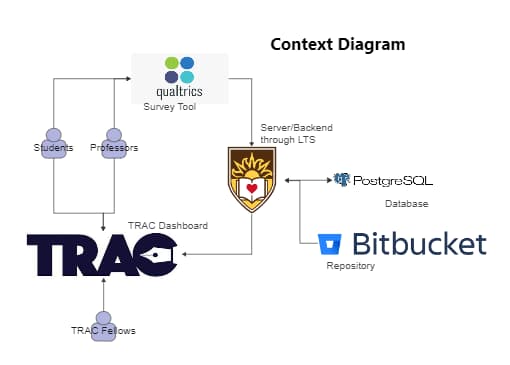
This context diagram illustrates the TRAC Dashboard System, showing the interactions between students, professors, TRAC fellows, and external tools such as Qualtrics, Bitbucket, and PostgreSQL. Data from students and professors is collected via Qualtrics surveys and processed through the TRAC Dashboard. The backend server, managed by LTS, utilizes PostgreSQL for data management and Bitbucket for version control and repository. This diagram provides a clear overview of the different components and data flows involved in the TRAC system.