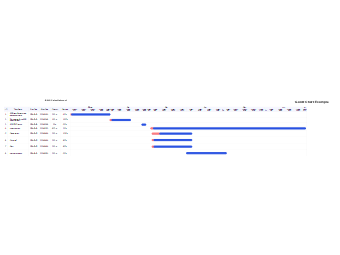
Crafted with EdrawMax, this Gantt chart details the timeline for the establishment of an Information Security Management System (ISMS). It outlines key tasks, their start and finish dates, durations, and the percentage of completion. Color-coded bars indicate progress over time, providing a visual representation of the project schedule and its milestones, which is essential for project planning and tracking.


 Desktop