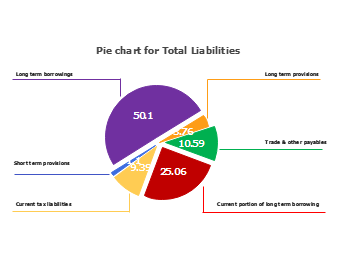
This pie chart illustrates the breakdown of total liabilities, emphasizing the significant portion occupied by long-term borrowings. Over half of the total liabilities are attributed to long-term financial obligations, indicating a substantial debt commitment for the entity represented. The chart provides a visual representation of the distribution of liabilities, allowing for a quick understanding of the financial structure and risk profile.


 Desktop