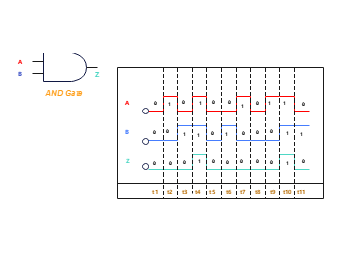
The timing diagram above shows the operation of an AND gate, showing the change in current over time. When the line is low, it indicates the status 0, and when it is high, it indicates the status 1. Gate Z takes inputs A and B and outputs 1 only if both inputs satisfy the condition of the Gate (Both inputs 1); Otherwise, the output will remain 0. This diagram visually represents the logic operation of an AND gate, showing how to process the input signal to produce the corresponding output.


 Desktop