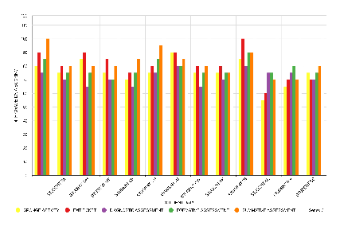
The bar chart is reflective of data collected from students to provide a visual analysis of what students know, what they should know and what is neccessary to meet their academic needs. The focus of the analysis is on mathemetics for a 4th grade class that includes, Sponge Activities, Exit Tickets, Diagnostic Assessments, Formative Assessments, and Summative Asssesments.