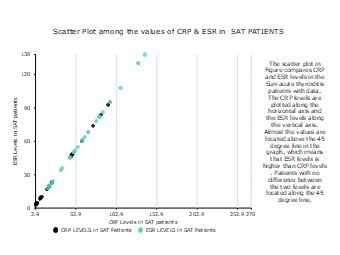
The scatter plot in Figure compares CRP and ESR levels in the Sun-acute thyroiditis patients with data. The CRP levels are plotted along the horizontal axis and the ESR levels along the vertical axis. Almost the values are located above the 45 degree line in the graph, which means that ESR levels is higher than CRP levels . Patients with no difference between the two levels are located along the 45 degree line.


 Desktop