Templates Community /
Calculation statistics flow chart
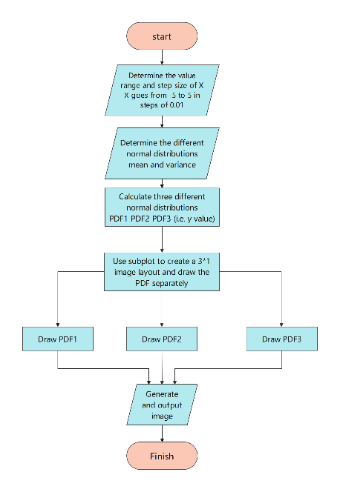
Calculation statistics flow chart
HudsonC
Published on 2024-10-03
Generate Diagram with AI
Template
Desktop
Draw the density image using matlab. This flow chart clearly depicts the entire process from determining the normal distribution parameters, to calculating the PDF value, to drawing and outputting the normal distribution image.
Share
Report
0
2
Add a comment
Post
Close
Close


 Desktop