
Templates Community /
Research 2 Project Timeline: Gantt Chart for Industry Visit and Presentation Tasks
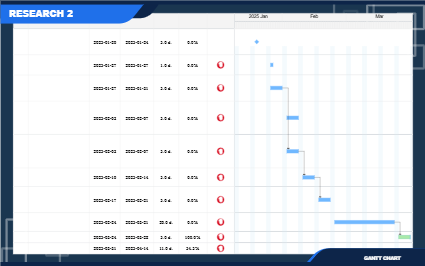
Research 2 Project Timeline: Gantt Chart for Industry Visit and Presentation Tasks

Published on 2025-01-11

 Desktop


Post
Recommended Templates
